What is eye-tracking useful for?
19 November 2019 - Julia Mullinger & Amy McInnes
A real range of UXers travelled from across the UK to visit us on World Usability Day. Over 20% of our 120 attendees at World Usability Day lined up to find out what eye-tracking is useful for and to try out the technique for themselves. We had a mix of experience, with some who had heard of and used eye-tracking, to those who were viewing it for the first time. A common theme from our chats on the day was that many stakeholders often ask for eye-tracking not fully understanding what it was, nor when it should be used…just that it was a ‘great visual’. So, to help with all of this, we shared some of the key things that eye-tracking can tell us to showcase how and when it should be used.
What can eye-tracking tell us?
- Which visual content attracts attention?
- How quickly visual content is seen?
- Which visual content is ignored/overlooked?
- In which order the visual elements are seen?
- How one visual layout compares with another?
Eye-tracking is a great tool, but it’s not always the right tool for every research question. In this article we’re going to explore the many metrics eye-tracking produces and what you can do with them by focusing the days research on Smart Meter design.
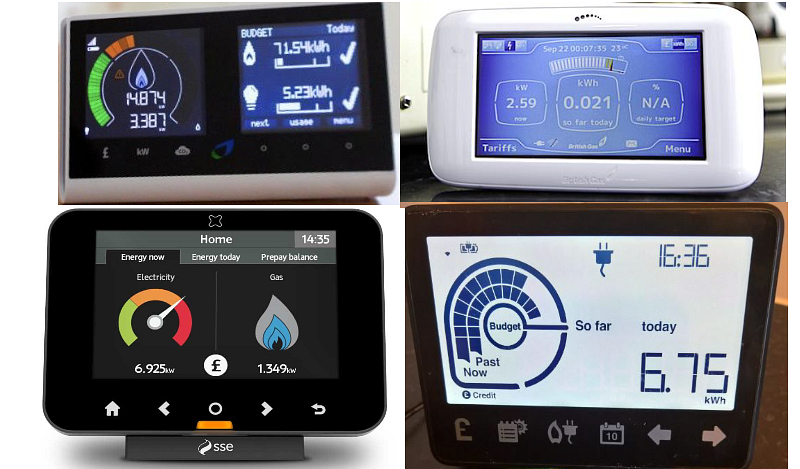
Inspired by this year’s World Usability Day theme, ‘Design for the future we want’, we asked our keen eye-tracker testers to look at four smart meter interfaces and tell us:
What they spent on gas and electricity that day?
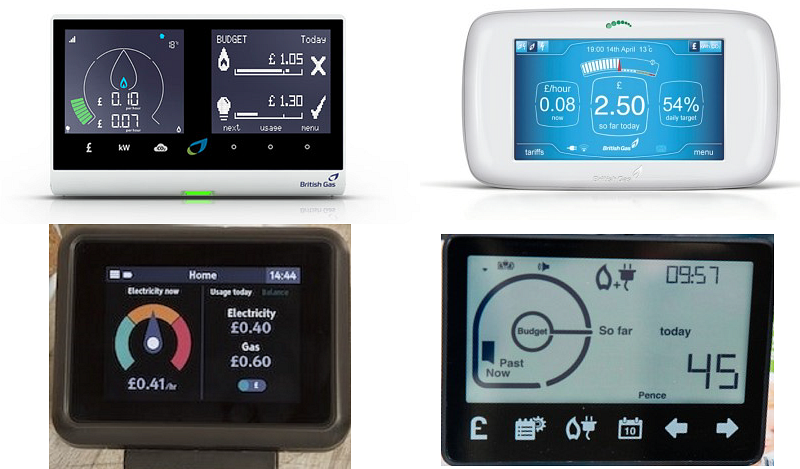
How much gas and electricity had they used?
Most participants knew what a smart meter was, but few had a meter installed.
Based on what participants told us from looking at each of the smart meter interfaces, we found that the smart meters with an individual reading for gas and for electricity had a lower success rate of participants finding the content, than those with one overall reading.
The metrics that we shared with participants to show what eye-tracking can tell us included:
Heatmaps
Heatmaps can tell us which visual content attracts attention.
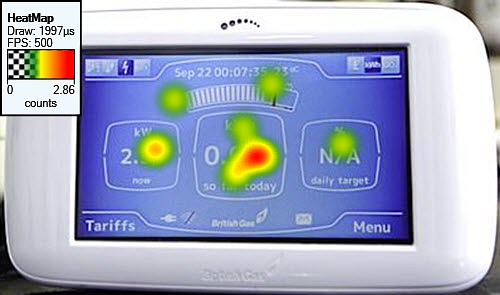
This is shown by where the eyes have been focusing on the image. The red represents the points on the image where the eyes were fixated.
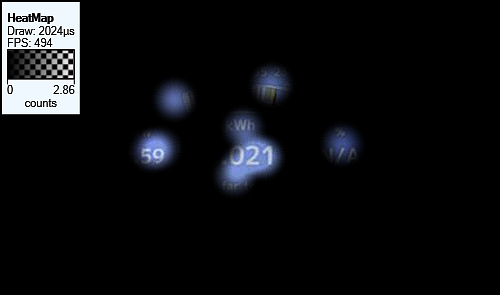
Gaze opacity
This is the opposite view of a heatmap, it shows us the fixations of where participants looked.
Gaze plots
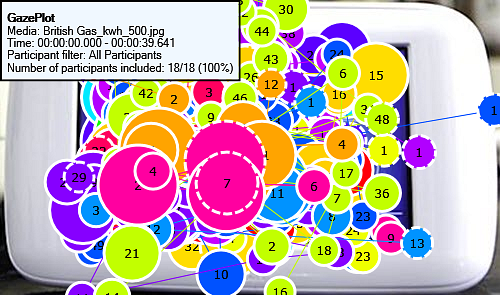
A gaze plot is a map of where the eye has been looking at an image and it can tell us:
- Where the eyes focus on the page – shown by the placement of the dot on the image
- In what order they see which content – shown by the number on the dot
- Which content is fixated on for longest – shown by the size of the dot on, the larger it is, the longer the participant spent looking at that content.
Time to first fixation
The time to first fixation is the amount of time it takes the participant to ‘see’ the content they are looking for. The eye-tracking software calculates this time, which you can compare across interfaces and individuals or groups of participants.
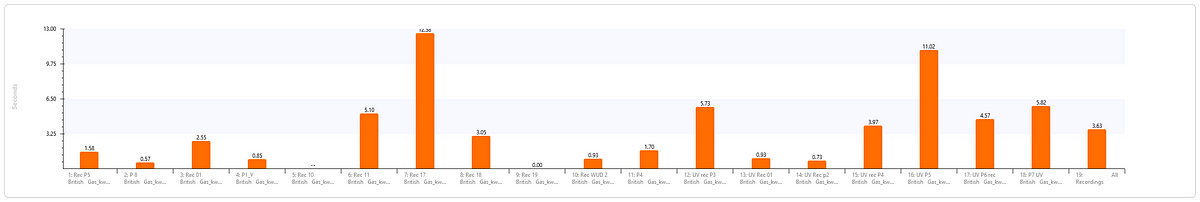
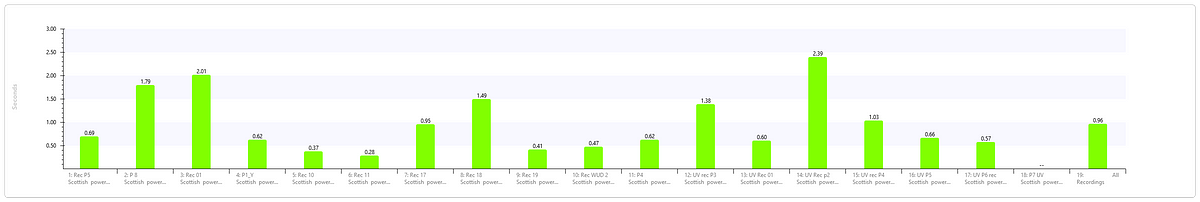
The graphs show smart meters with one piece of content that was tracked as being seen. You can compare participants on each interface as well as the average time of all participants combined.
We had a great day showing those who came how to use an eye-tracker, what can be produced from it, and the benefits of it as a research tool. We were also pleased to see that the results from all the testing highlighted a difference in the successfulness of the readability in the design of the different smart meters.
If you would like to explore how eye-tracking can help you answer your research question, or would like to find out more just get in touch.
Find out more about World Usability Day 2019.
You might also be interested in...
AI Has a UX Problem: What the ISO RIA Systems framework Means for Trustworthy AI
6 July 2026AI is not just a technical challenge. It is a UX challenge, and the way people understand, trust and act on AI outputs matters more than ever.
Read the article: AI Has a UX Problem: What the ISO RIA Systems framework Means for Trustworthy AICreating Space for Surprise in User Research
1 June 2026Good user research creates space for surprise - exposing blind spots, challenging assumptions and helping teams make better decisions.
Read the article: Creating Space for Surprise in User ResearchApplying the Three Lenses Model: How to Integrate MR, CX and UX Research
21 April 2026Knowing the three lenses is one thing — here's how to actually use them together without restructuring your entire research function.
Read the article: Applying the Three Lenses Model: How to Integrate MR, CX and UX Research