Knowing your users’ tasks – a key to UX success
10 December 2020 - Chris Rourke
.png)
You’ve got lots of traffic on your site from visitors from far and wide – congratulations! But do you know why they came? Seriously, do you really know what they came to your site for? Or if they could even do what they wanted to do?
It may be terribly obvious, but the best way to provide a good experience to your visitors is to let them do what they came there to do. It’s as simple as that really. That good experience leads to repeat visits, engagement and customer advocacy all of which contributes to your success.
The task is key – but hard to determine
The more you know about two key questions then the more you can provide the right content and interaction design. These two questions are:
- why people come to your site - their task
- whether they could do what they wanted to - their success
Knowing your visitors’ tasks lets you signpost to the content related to those important tasks better through improved navigation. If you also know how well they can succeed in these tasks, then you can look more closely at the tasks they’re struggling with and make the appropriate changes to improve their performance. It doesn’t matter how much information you’ve provided on your site or how pretty your pages are – if you’ve not met their intended task, your visitor will go away unsatisfied and unlikely to return.
Unfortunately knowing (or even guessing) site visitors’ tasks is difficult because common ways of gathering this evidence are inadequate on their own. Many insight methods and tools provide tantalising clues to the mystery of visitor tasks. Others show clearly what they did but not really what they wanted to do or whether they actually succeeded in their task.
Let’s look at some common ways that site managers try to understand what is happening on their site and whether they reveal the tasks users are trying to perform.
Google Analytics
The central record of what people do on your site is a treasure trove of information. From the vast analytics database we can learn where they came from, how many pages they visited, average time per page, paths through the site, the ‘bounce rate’ and whether they tripped the wires on your pre-defined conversion funnels. You can see what they did en masse and through anonymous individual journeys. But knowing why they came is a different question and the answers are speculative at best. Sometimes the query words typed into the search engine before coming to your site provide a clue but even those are often high level and vague data especially with the variety of different search queries people create. And although studying the journeys taken through your site indicates what they did, it does not show how well that aligns to what they intended to do, let alone whether they succeeded or were happy with their experience.

In site search queries
Another tempting information source is the words people type in to your own site’s search engine. In site search query logs can provide useful clues but again are often vague indications of their goal. On a government site they may type ‘tax’ into the search but which of the dozens of tax-related specific tasks do they want to do? The intent sometimes becomes clearer based on which search result they choose to follow but even that it is speculative. Did they succeed in their task? It is difficult to know from the subsequent interactions. Even if they get to what you think is the right page for that task, did they understand the information you provided and go away feeling they got what they came for? A further challenge is that in site search queries are skewed because they tend to be for tasks that visitors can’t obviously see how to do on your site. If a visitor’s task is clearly signposted on the home or landing page, they are unlikely to type the same thing into your search engine. So the most common tasks may be under-represented in your search queries.

Phone contact and call centres
I’ve often felt that call centres are an unappreciated source of useful feedback for organisations. The call centre agents are at the coal face, hearing directly from the current or prospective customers about problems or questions they have about your service. A certain percentage of these inbound callers are using this phone channel as their next resort after being unable to achieve their goals on your site. The problem is those callers are a minority of the overall callers, and unless they announce ‘I tried to do this on your site but I couldn’t do it …’ the call centre agent is devoid of potentially useful information linking their query to tasks they tried to perform on the website. And for the many (hopefully most) that can perform their desired online task with no problems, there is no record of their task goals or success. For these and other internal communication reasons (there is often a gap between the call centre teams and digital teams), the potential of learning about users’ tasks and experiences based on contact centre data alone is rarely achieved.

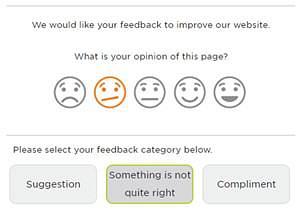
Site feedback forms
A similar problem exists for site feedback forms. They tend to be used by those experiencing difficulties but even then, the feedback provided is often too vague to be of any practical use. Many site owners get monthly reports showing quantitative measures on a happy face / sad face spectrum to indicate what visitors thought of a specific page or even their overall site user experience. But what task were they trying to do when they had that experience? Again missing this layer of information weakens the value of the scale ratings received. Site managers can also review qualitative open text feedback which let the visitor share their thoughts on the site. Some of these may have descriptions of specific problems that can be resolved but many are vague statements such as ‘the navigation confused me’, ‘I liked the images on the site’ or ‘there is too much content’. Again without knowing the task, much of this information is unhelpful and cannot be easily quantified and analysed to see the most popular tasks and their success rates.
Some site feedback forms do explicitly ask what the respondent was trying to do on the site and in these cases can provide more valuable insights on those individual tasks and issues encountered. However, even these tend to be filled in by those experiencing problems, thus providing a skewed view of what the actual tasks visitors come to the site for, which ones are most popular, their success or the trends over time. Site feedback forms promise much and can help to discover specific pain points, but they do not provide the broader picture of what users’ tasks are or the success in those tasks.
Session replay recordings
Several tools can capture video recordings of the users’ interactions with your site. These videos show a mouse moving around a page on your site, clicking a link, then doing the same on the next page…and the next and next until they leave. You can see mouse movements, clicks/taps, form input (masked for privacy), page scrolling, mobile gestures, screen resizing and more. It‘s like a front-row seat to watch real users browse your site.
However, it is often difficult to guess what task the visitor is trying to perform unless they are in a fairly obvious purchase or registration funnel. Unlike usability testing where participants perform the task you provide, these videos of browsing visitors are missing this crucial context. This can be frustrating to watch as you guess what each visitor is trying to do, let alone what they thought of their experience. Are they pausing on a page because the content is confusing or are they really loving it? Or making a cup of tea? Who knows?
Significant time is often needed to watch hours of session recordings, synthesise the video content and decide where the UX improvements opportunities are. Some systems use algorithms to help identify which users are ‘struggling’ based on their behaviour and paths, potentially reducing the volume to watch, but it is hard to get a clear picture of the popularity of tasks. Session replays are a promising method but on its own, without knowing each user’s tasks, can be frustrating for these reasons.
The power of discovering your user’s true intent
As we’ve seen, the apparent wealth of information from analytics, search logs, feedback and even recordings does not reveal the user’s actual task and success so that you can better understand their behaviour and design for greater success with this context.
We’ve always recognised the value of the task as the true North Star from the user’s point of view.
For this reason, we’ve always advocated the Top Tasks method pioneered by Gerry McGovern and Customer Carewords. This applies a comprehensive survey where participants select their top five tasks from a carefully curated list of options, providing useful information on their task priorities. This insight can be applied to improve the information architecture, providing better access to content related to the important tasks and helping to decide which content can be removed.
True intent research to see visitor task trends
In these times of changing online customer behaviour, it’s especially important to understand key aspects your users’ current experience starting with their current tasks. What are the most popular tasks, could they perform them, and what they will do if they can’t? To understand these questions we apply our true intent method which provides insights based on evidence from your site visitors every day.
Through a simple short visitor survey we first learn why they are visiting the site – their true intent – which is the key piece of the puzzle missing from so many other sources. The visitor can then try to perform their task and, whether they succeed or not, provide feedback for a range of useful insights from which improvements can be made. The information gathered includes:
- Which tasks each person is trying to perform?
- Across all visitors, what are the tasks rank-ordered by popularity?
- How successful were visitors across the different tasks?
- When unsuccessful, what do visitors perceive as the main barriers?
- What will people do if they can’t perform their task?
- How do the tasks vary across different user types?
- Do the tasks or their success rate vary across platform, geography or time periods?
- What paths do people follow to perform these tasks?
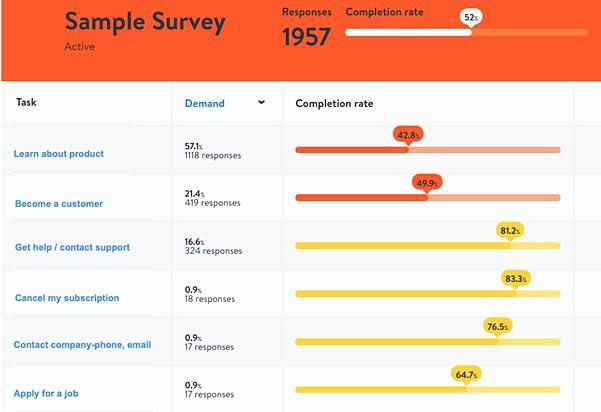
Armed with these insights of what users want to do and much more, we can see the main challenges and how to address them. For example from the top-level data below, we can see that learning about the product is a very popular task (57% of participating visitors), yet the success for that task is low, less than 50%. Other important tasks such as getting help or cancelling a subscription are performed less often and have a much higher success rate, and probably deserve a lower priority for improvement.
From this point, we can drill down further to see what visitors report as barriers to performing tasks, whether there are differences between mobile and desktop and much more. We can also integrate Google Analytics with the tasks information to see which paths are followed for each task – are they following your desired ‘happy path’? And for users of Hotjar which provides visitor screen recordings, we can know exactly what tasks they are performing so that reviewing the recording videos is far more useful.
Evidence to make the most of your UX resources
Everyone knows continuous user experience improvement comes from regular user research. But your time and resources to improve the user experience are limited. For many ambitious digital teams, the question which often looms large is ‘which areas of the site do we need to improve next?’
The beauty of true intent is it highlights which areas to focus on based on the relative popularity of each task and the success rate that visitors achieve. It acts as an early warning system by clearly revealing the most frequent tasks and those with the lowest success. Because of the strong empirical basis from hundreds of users, the true intent research method helps you apply your research and design resources where they are needed most.
Making UX a measurable management metric
When true intent studies are repeated regularly you can clearly see trends over time and the positive impact of the changes you implemented. In the world of UX, few things are more gratifying than clear evidence that a task which previously achieved less than 60% success improves over time to 80% or 90% through iterative improvements.
Summary – The importance of knowing WHY
There are good ways to understand what people are doing on your site, where they spend their time and what they type into your search engines. But without knowing why they are there and whether they actually succeeded, this information is only partially useful.
We would be glad to help apply this task-based approach to improving the user experience on your site through methods such as top tasks identification and true intent studies. To find out more please get in touch with User Vision.
You might also be interested in...
Nothing About Us Without Us: What CRPD at 20 Means for UX
16 June 2026As the Convention on the Rights of Persons with Disabilities turns 20, this article asks what “Nothing About Us Without Us” should mean for UX in practice. It argues that accessibility is not just about testing whether something works for disabled people, but involving disabled people earlier in shaping what gets built.
Read the article: Nothing About Us Without Us: What CRPD at 20 Means for UXKano as a Lens for Innovation and Competition
4 June 2026How Kano explains innovation, disruption and competitive advantage.
Read the article: Kano as a Lens for Innovation and CompetitionCreating Space for Surprise in User Research
1 June 2026Good user research creates space for surprise - exposing blind spots, challenging assumptions and helping teams make better decisions.
Read the article: Creating Space for Surprise in User Research